


Cart 0


Google Analytics is an indispensable tool for digital marketers, website owners, and anyone interested in understanding their website’s performance. With its extensive data and insights, Google Analytics helps you comprehend your audience, track conversions, and optimize your website’s effectiveness. However, navigating through its comprehensive dashboard can be overwhelming for new users. This article aims to provide guidance on managing the Google Analytics Dashboard and locating its essential elements.
Getting Started with the Dashboard
When you first log into Google Analytics, you are greeted with the Home Dashboard, a snapshot of your website’s performance. To get started, just follow the steps below.
Step 1: Sign Up for a Google Analytics Account
- Go to the Google Analytics website (google.com/analytics).
- Click on “Start for free” or “Sign in to Analytics” if you already have a Google account.
- Follow the prompts to create a new account. You’ll need to provide some basic information about your website, such as its name and URL.
Step 2: Install the Tracking Code on Your Website
- Once your account is set up, Google Analytics will provide you with a unique tracking code.
- Install this code on every page of your website. The process varies depending on your website platform (e.g., WordPress, Shopify).
- This code enables Google Analytics to collect data from your website.
Step 3: Configure Your Account
- Set up properties and views to organize your data. Properties represent your websites or apps, and views are subsets of property data.
- Consider setting up filters to exclude internal traffic or specific IP addresses.
Step 4: Accessing Google Analytics
- After installation, log in to your Google Analytics account.
- Navigate to google.com/analytics and enter your Google account credentials.
This overview includes key metrics like user sessions, bounce rates, and conversion rates. To get started, ensure you’re viewing the correct account, property, and view from the dropdown menus at the top.
Exploring the Home Page of GA4
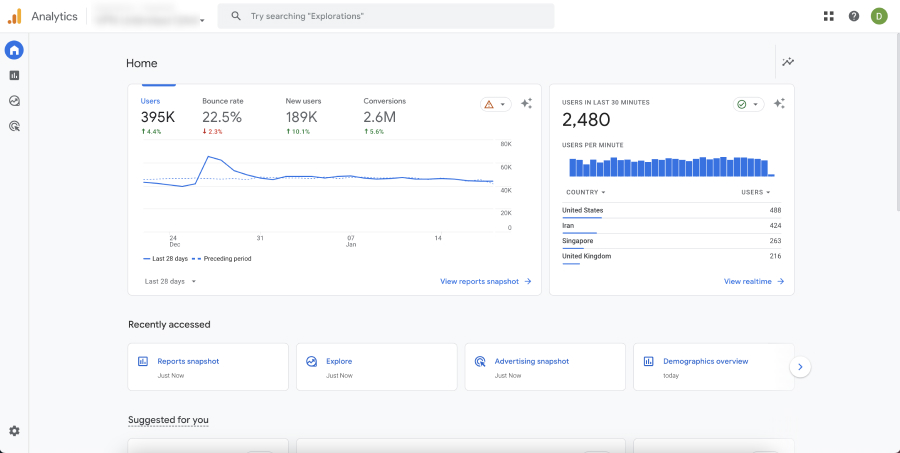
The Home page in Google Analytics 4 (GA4) provides an overview of key data and metrics for your website or app. It’s designed to give you a quick snapshot of the most important information at a glance. Here’s what you can typically find on the Home page:
- Summary Cards: These are small widgets that display key metrics such as user count, engagement rate, and revenue. They give a quick overview of your site’s or app’s performance.
- Real-Time Data: This section shows what’s happening on your site or app right now. You can see the number of active users, their geographic locations, the pages or screens they’re viewing, and more.
- Trended Data: This includes graphs and charts that show trends over time, such as user acquisition, user engagement, and revenue trends.
- User Engagement Metrics: These metrics can include sessions, average engagement time, and bounce rate.
- Demographic and User Behavior Data: This may include information about the users’ age, gender, interests, the devices they’re using, and the channels through which they found your site or app.
- Automated Insights: GA4 uses machine learning to provide insights and highlights about your data. These insights can alert you to significant trends or changes in your data.
- Customization Options: You can customize the Home page to prioritize the data that’s most relevant to you. This could include adding or removing summary cards, changing the layout, etc.
Each element on the Home page is designed to provide a high-level view of your site or app’s performance, making it a great starting point for your analytics journey. Remember, the specific data and layout can vary depending on how your GA4 property is set up and the type of business you’re running.
Navigating to Reports, Explore, and Advertising
The “Reports,” “Explore,” and “Advertising” menus on the left are key components of the Google Analytics 4 (GA4) interface, each serving a distinct purpose.
Reports
- The Reports menu in GA4 is where you access a variety of pre-built reports that present data about your website or app. These reports are organized into various categories such as:
Life Cycle Reports: Including acquisition, engagement, monetization, and retention reports. These provide insights into how users find and interact with your site or app, how they contribute to revenue, and their return patterns. - User Reports: Provide demographic details, interests, and other user-related information.
Each report can be further customized to include different metrics, dimensions, and segments that are relevant to your analysis. The Reports menu also includes the ability to create new custom reports tailored to specific needs.
Explore
The Explore section is a powerful feature in GA4 that allows for more in-depth analysis. It provides a flexible environment where you can create custom analyses and visualizations.
You can use various templates or start from scratch to build analyses like cohort analysis, user explorer, path analysis, and more.
This area is particularly useful for advanced users who want to dig deeper into their data, find specific patterns, or answer complex business questions.
Advertising
The Advertising menu in GA4 is designed to integrate with Google’s advertising platforms, like Google Ads and Google Marketing Platform. This menu helps you understand how your advertising campaigns are performing in terms of driving traffic, engagement, conversions, and revenue. You can see data like campaign performance, user acquisition from ads, and the effectiveness of different advertising channels.
It’s a valuable tool for marketers to measure return on investment (ROI) and optimize ad spend.
Each of these menus serves a different purpose, ranging from providing ready-made reports to facilitating in-depth custom analysis and tracking advertising performance. Together, they make GA4 a comprehensive tool for understanding and optimizing your web and app performance.
Exploring the Reports Menu

Returning to the Reports section, let’s talk about one of the most exciting features like Real-Time reports. Located in the left sidebar, these reports give you a live overview of what’s happening on your site right now. You can see how many people are on your site, what pages they’re viewing, and where they’re from. This is particularly useful for monitoring the immediate effects of social media posts or news articles.
The Life Cycle Reports in Google Analytics 4 (GA4) is another section in the Reports menu. They are designed to give you insights into the user journey, from how users discover your site or app to how they engage with it, contribute to revenue, and return over time. Here’s a detailed look at each of these report categories.
Acquisition Reports
- Acquisition reports provide information on how users arrive at your site or app.
- Key metrics include user acquisition, traffic source, and medium (e.g., organic, paid, referral).
- These reports help you understand which channels (like search engines, social media, email campaigns) are most effective at driving new users and sessions.
- You can analyze data such as the number of new users, sessions, and user engagement metrics by acquisition source and campaign.
Engagement Reports
- Engagement reports focus on how users interact with your site or app once they arrive.
- These reports cover metrics like session duration, pages or screens per session, events (like button clicks or video plays), and bounce rate.
- You can also see which content is most engaging, track user flows through your site or app, and identify areas where users might be dropping off.
- Engagement reports are crucial for understanding user behavior and improving user experience.
Monetization Reports
- Monetization reports detail how your site or app generates revenue.
- For ecommerce sites, these reports can include data on revenue, transactions, average order value, and products sold.
- For apps or other types of sites, monetization might be tracked through in-app purchases, subscriptions, or ad revenue.
- These reports help you understand which products or services are most profitable, how purchasing behavior varies among user segments, and the effectiveness of your sales funnel.
Retention Reports
- Retention reports show how well you’re retaining users after their first visit.
- These reports typically display the number of users who return to your site or app within specific time frames (e.g., daily, weekly, monthly).
- Retention is measured by cohorts, which group users based on their first visit date, allowing you to track how specific groups retain over time.
- Retention reports are vital for understanding user loyalty, the long-term value of different user segments, and the effectiveness of engagement and re-engagement strategies.
Each of these report categories in GA4 provides valuable insights into different stages of the user journey. By analyzing these reports, you can make data-driven decisions to optimize your marketing strategies, enhance user experience, improve engagement and retention, and ultimately increase revenue.
Managing User Reports in Reports Section
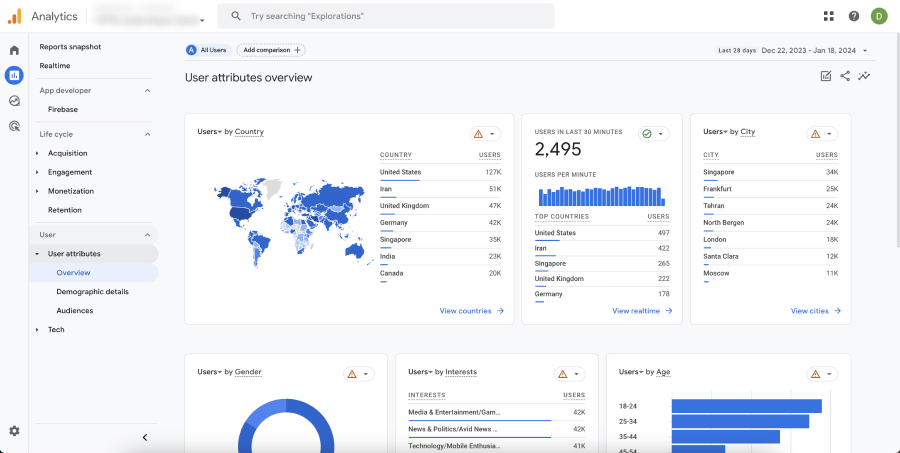
User Reports in Google Analytics 4 (GA4) offer detailed insights into the characteristics and preferences of your website or app users. These reports are invaluable for understanding your audience and tailoring your content, marketing, and product strategies to better meet their needs. Here’s a detailed look at what User Reports typically include:
- Demographics: These reports provide data on the age and gender of your users. You can see the distribution of your users across different age groups and genders. This information helps in understanding which demographic segments are most engaged with your site or app and can be used to tailor marketing and content strategies to specific age groups and genders.
- Interests: These reports reveal the interests and preferences of your audience based on their online browsing and purchasing behavior. Categories might include interests like technology, sports, fashion, travel, and more. This data is beneficial for segmenting your audience and creating more targeted and relevant marketing campaigns.
- Location: Geo reports provide insights into the geographic location of your users, including country, region, and city. This information is useful for localizing content, identifying market opportunities in specific regions, and understanding geographical trends in user behavior.
- Technology: Technology reports show what devices, operating systems, and browsers your users are using to access your site or app. This information is crucial for optimizing the user experience across different devices and ensuring compatibility with popular browsers and operating systems.
User Reports in GA4 are instrumental in painting a comprehensive picture of who your users are and what they’re interested in. By leveraging this data, you can make more informed decisions about product development, marketing strategies, content creation, and overall user experience design.
Conclusion

Navigating the Google Analytics Dashboard effectively is crucial for leveraging the power of this tool. By familiarizing yourself with its different sections and features, you can gain valuable insights into your website’s performance and make informed decisions to improve your online presence. Remember, Google Analytics is a dynamic tool, so continually exploring and experimenting with its features is key to mastering it.