

Cart 0

Understanding where your website traffic comes from is essential in digital marketing. Google Analytics Acquisition Reports provide valuable data about the origins of your traffic and the effectiveness of your marketing efforts. These reports categorize traffic into different channels such as Organic Search, Direct, Referral, and Social. Each channel provides insights into how visitors are reaching your site, allowing you to understand which marketing efforts are most effective. This guide will help you navigate these reports, analyze key metrics, and use this information to inform your marketing strategies.
Navigating Google Analytics for Acquisition Reports
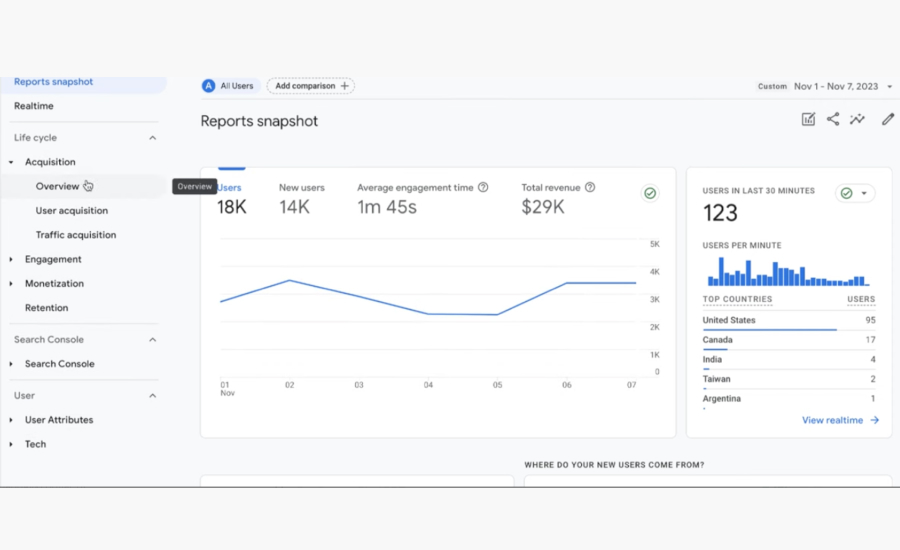
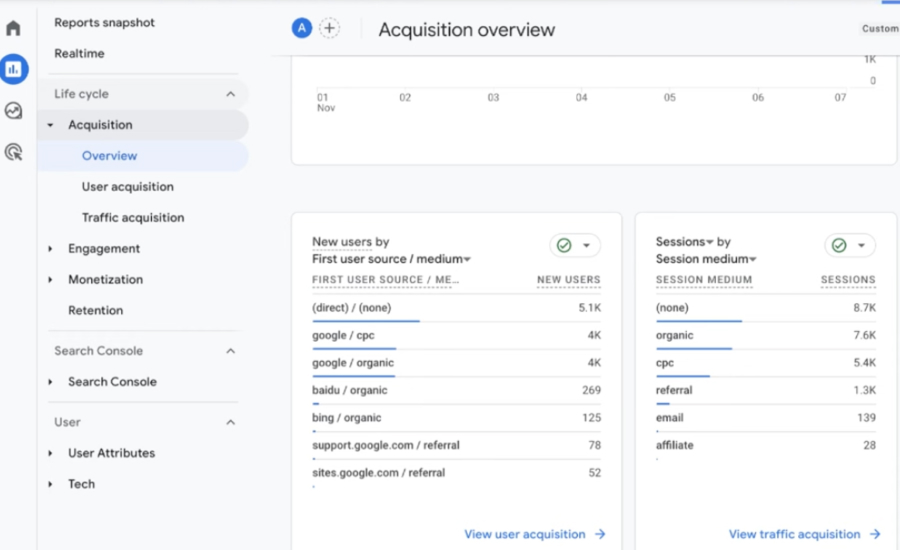
To access Acquisition Reports in Google Analytics, start by logging into your account. From the dashboard, navigate to the “Acquisition” section on the left-hand menu. Here, you’ll find various subsections, including “Overview,” “All Traffic,” “Source/Medium,” and more. The Acquisition Overview page provides a snapshot of your traffic channels, showing key metrics like Sessions, New Users, Bounce Rate, and more. This overview helps you quickly see which channels are driving the most traffic and how those visitors are interacting with your site.
Key Metrics to Analyze
- Sessions: This metric counts the total number of visits to your website. It gives you an idea of your site’s overall traffic volume.
- New Users: This shows the number of visitors coming to your site for the first time. Tracking new users can help you gauge the effectiveness of your outreach efforts.
- Bounce Rate: This is the percentage of visitors who leave your site after viewing only one page. A high bounce rate can indicate that visitors are not finding what they need.
- Pages/Session: This metric measures the average number of pages a visitor views during a single session. It provides insight into how engaged your visitors are with your content.
- Average Session Duration: This shows the average time visitors spend on your site. Longer sessions typically indicate higher engagement and interest.
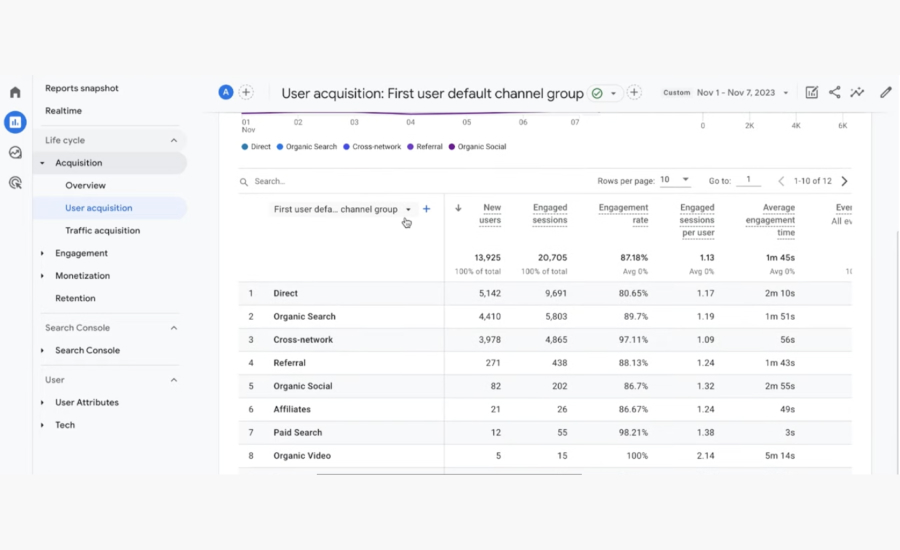
Analyzing Traffic Channels
- Organic Search: This channel includes visitors who find your site through search engines like Google. A high volume of organic search traffic indicates strong search engine optimization (SEO). To improve this channel, focus on creating high-quality content and optimizing your site for relevant keywords.
- Direct: Direct traffic comes from users who type your website’s URL directly into their browser or have it bookmarked. This can indicate strong brand recognition and loyalty. It’s important to ensure your URL is easy to remember and promote it through offline channels.
- Referral: Referral traffic includes visitors who come from other websites. This could be through links in articles, blog posts, or online directories. Building relationships with other websites and getting featured on high-traffic sites can boost referral traffic.
- Social: Social traffic comes from social media platforms like Facebook, Twitter, Instagram, and LinkedIn. Analyzing this channel helps you understand which social networks are driving the most traffic and which types of content perform best on each platform.
Interpreting Data for Actionable Insights
- Identify Trends: Look for increases or decreases in traffic from specific channels over time. For example, a spike in organic search traffic may coincide with a recent SEO campaign.
- Segment Data: Use segmentation to drill down into specific groups of visitors. For instance, you can segment by device type, location, or new vs. returning users to understand their behavior better.
- Set Goals and Track Conversions: Define goals in Google Analytics, such as form submissions, purchases, or newsletter sign-ups. Tracking these goals helps you measure the effectiveness of different channels in driving conversions.
- Adjust Marketing Strategies: Use the insights gained to refine your marketing strategies. If social traffic is low, consider increasing your presence on social media. If referral traffic is high from certain sites, explore similar partnerships.
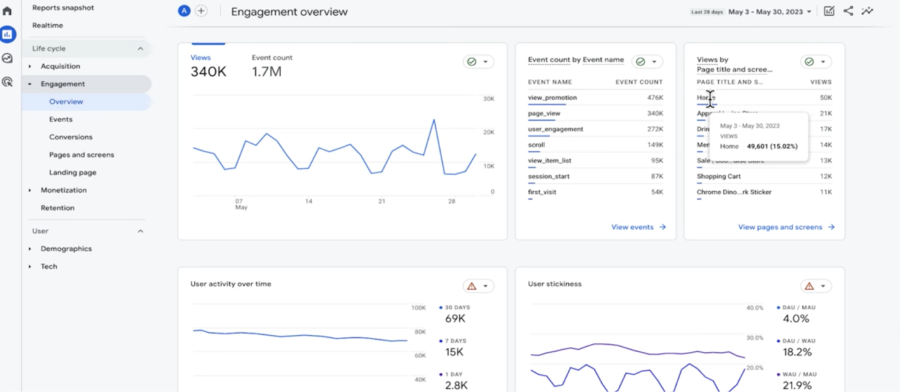
Engagement Metrics
In addition to acquisition metrics, tracking user engagement is crucial for understanding how visitors interact with your content. The Engagement Overview provides insights into metrics such as views, event count, user activity over time, and user stickiness.
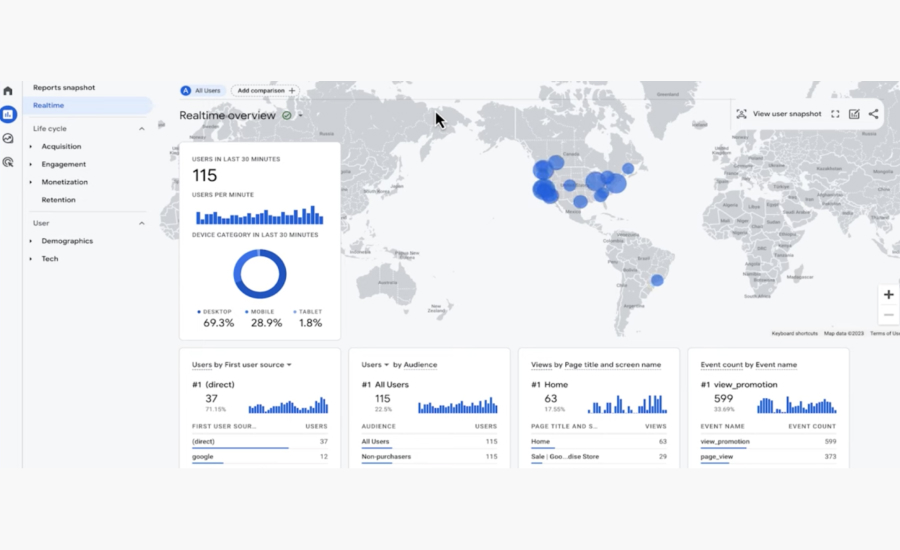
Real-Time Data
Monitoring real-time data in Google Analytics gives you immediate insights into user activity on your website. The Realtime Overview shows live data on users currently on your site, their geographic locations, and the pages they are viewing.
Case Study: Real-World Application
- Analyzing Traffic Channels: By examining their Acquisition Reports, they found that their organic search traffic had decreased dramatically. They realized their recent website redesign had inadvertently removed several key SEO elements.
- Key Metrics Review: The business looked at the bounce rate and average session duration. The bounce rate for organic search traffic was much higher than before, indicating that users were not finding the site relevant anymore.
- Segmentation: They segmented their data by location and device, discovering that mobile users from a specific region were experiencing longer load times, leading to higher bounce rates.
- Action Taken: The business re-optimized their website for SEO, restored the missing elements, and improved mobile site performance. They also focused on content marketing to regain their lost rankings.
- Results: Within a few months, their organic search traffic rebounded, bounce rates decreased, and average session duration increased. Sales started to pick up as more visitors found the site relevant and engaging.
Best Practices for Using Acquisition Reports
- Regular Monitoring: Check your Acquisition Reports frequently to stay updated on traffic trends and identify any sudden changes.
- Set Up Goals and Conversions: Define clear goals in Google Analytics, such as newsletter sign-ups, purchases, or contact form submissions. Tracking these goals helps you measure the effectiveness of each traffic channel in driving valuable actions.
- Use Annotations: Add annotations in Google Analytics to mark significant events, such as marketing campaigns, website updates, or industry changes. This helps you correlate traffic changes with specific actions or events.
- Integrate with Other Tools: Enhance your analysis by integrating Google Analytics with other tools, like Google Ads, Search Console, or social media platforms. This provides a more comprehensive view of your marketing performance.
- Custom Dashboards: Create custom dashboards in Google Analytics to track the metrics most important to your business. This makes it easier to access and interpret your data quickly.
- Segment Your Data: Use segmentation to analyze specific groups of visitors, such as new vs. returning users or traffic from different geographic locations. This provides deeper insights into the behavior and preferences of different audience segments.
Conclusion
Understanding and analyzing Google Analytics Acquisition Reports is crucial for any business looking to optimize its online presence. By regularly monitoring key metrics and traffic channels, you can gain valuable insights into your audience’s behavior and the effectiveness of your marketing efforts. Use this data to inform your strategies, set goals, and track conversions. With the right approach, Acquisition Reports can help you make data-driven decisions that improve your website’s performance and drive business growth.