

Cart 0

In the vast expanse of data analysis, Google Analytics (GA) stands as a beacon for marketers, webmasters, and data analysts, offering a plethora of tools and features to decipher the behavior of website visitors. Amidst its arsenal, Google Analytics Annotations emerge as a subtle yet powerful feature, often overlooked but immensely beneficial for those who venture into its utility. This article aims to demystify Google Analytics Annotations, guiding you through their purpose, benefits, and the steps to effectively utilize them in both Universal Analytics (UA) and Google Analytics 4 (GA4).
What are Google Analytics Annotations?
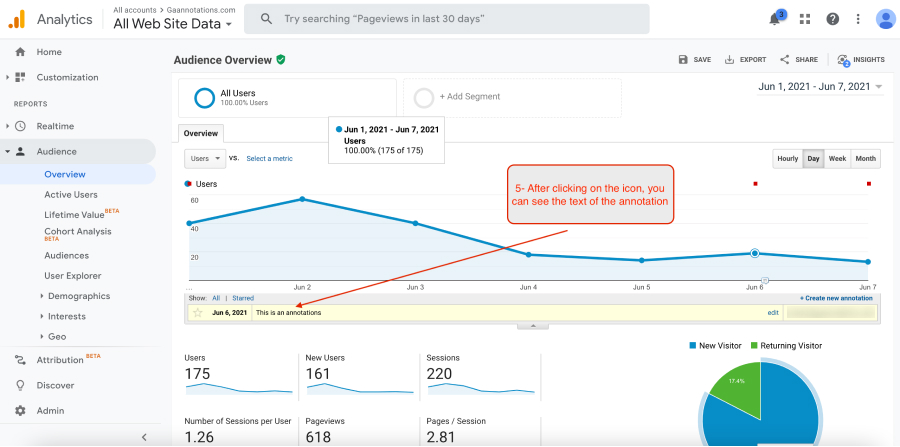
At its core, Annotations in Google Analytics are simple notes that can be added to the analytics timeline to mark specific events or observations. These notes serve as reminders or markers for significant occurrences that could affect website data, such as marketing campaigns, website updates, or external factors like holidays and economic shifts. Annotations appear as small speech bubble icons along the timeline in your GA reports, offering a quick reference to pinpoint why data fluctuations may have occurred.
The Utility of Google Analytics Annotations
The true value of Annotations lies in their ability to provide context to your data. In the dynamic digital environment, numerous factors can lead to sudden spikes or drops in traffic, conversions, and other metrics. Without proper context, these fluctuations can lead to misinterpretations. Annotations act as a diary, recording key events that influence your data, enabling you and your team to make informed decisions and analyses.
- Campaign Tracking: Mark the start and end of marketing campaigns to correlate their impact on website traffic and conversions.
- Website Changes: Note updates or changes to your website, such as new features, redesigns, or content updates, to monitor their effects on user behavior.
- External Events: Record external events like holidays, industry-related events, or economic changes that could affect your website’s performance.
- Collaboration: Share insights and notes with team members, ensuring everyone is on the same page regarding the factors influencing data trends.
Adding Annotations in Universal Analytics
In Universal Analytics, adding Annotations is a straightforward process:
- Navigate to Your Report: Open your Google Analytics account and go to the report where you wish to add an annotation.
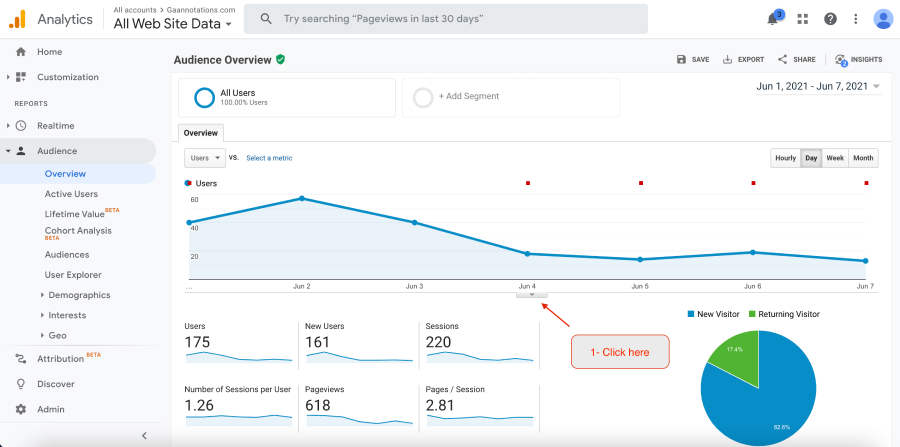
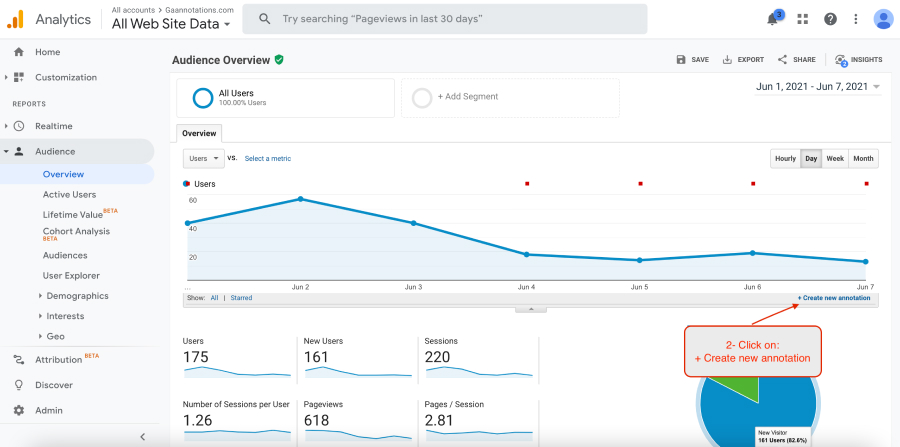
- Select the Timeline: Below the graph at the top of the report, you’ll find the timeline. Click on the downward arrow beneath the timeline.

- Add New Annotation: Click on the “+ Create new annotation” link on the right-hand side.
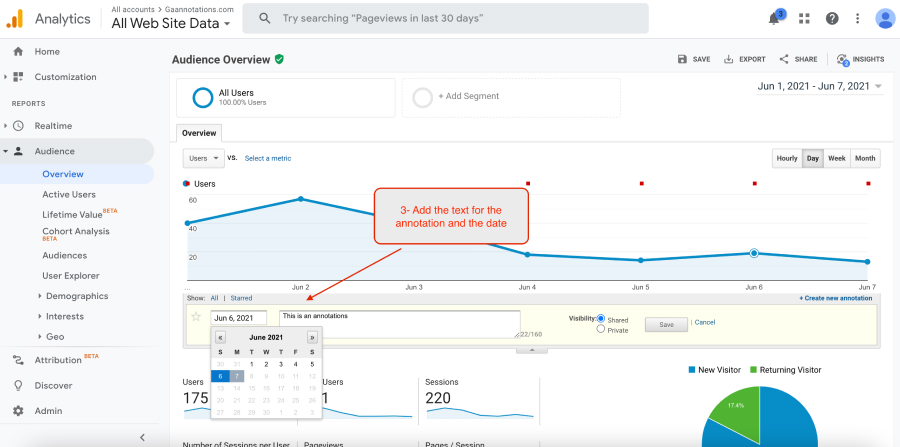
- Fill in the Details: Select the date for your annotation, type your note, and choose whether the annotation should be shared (visible to all users of the GA account) or private (visible only to you).
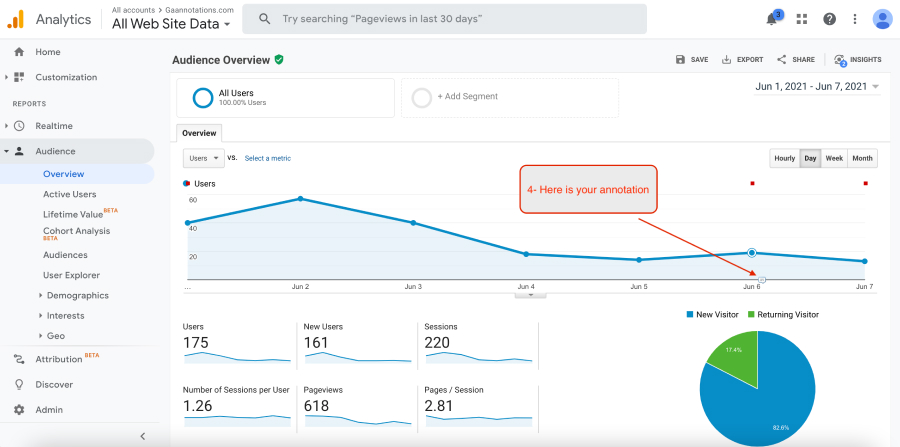
- Save: Click “Save” to add your annotation to the timeline.
Annotations in Universal Analytics are invaluable for historical data analysis, providing insights and reminders of past events that could affect data interpretation.
Transitioning to Google Analytics 4 (GA4)
With the advent of Google Analytics 4, there have been significant changes in how data is collected and presented. However, one notable absence in the initial GA4 rollout was the Annotations feature, which was a staple in Universal Analytics. This led to some initial challenges for users accustomed to leveraging annotations for data context.
Workarounds and Solutions in GA4
As of my last update, direct annotation features were not available in the GA4 interface. Users have had to employ creative workarounds to incorporate similar functionality:
- Utilize Google Sheets or Similar Tools: Create a shared document where team members can record dates and details of events affecting website data. While not integrated into GA4, this method ensures that a centralized log is maintained.
- Leverage Event Tracking: For certain types of annotations, like website updates or campaign starts, consider using GA4’s event tracking capabilities to log these occurrences. This method requires a more technical setup but integrates directly with your analytics data.
How to Add Annotations to Google Analytics 4
Setting Up Your Spreadsheet for Annotations in Google Sheets
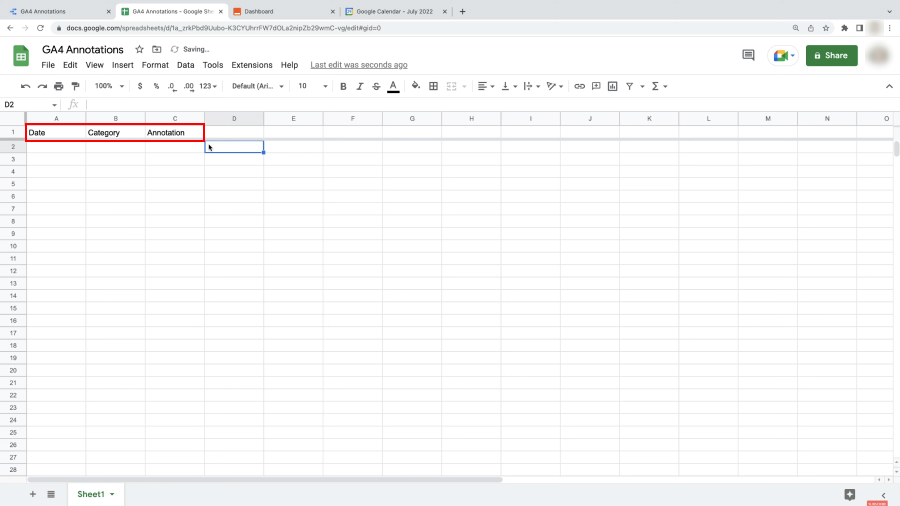
- Open Google Sheets: Navigate to Google Sheets and click on the “+ Blank” button to create a new spreadsheet.

- Name Your Spreadsheet: Click on the untitled spreadsheet at the top and name it ‘GA4 Annotations’ or any name you prefer for easy identification.
- Create Columns for Your Data:
- In the first row, label the columns as follows: A1 as ‘Date’, B1 as ‘Category’, and C1 as ‘Annotation’.
- The ‘Date’ column will contain the date of the event or change you’re annotating.
- The ‘Category’ column is optional and can be used to classify annotations, such as ‘Website Changes’, ‘Marketing Campaigns’, etc.
- The ‘Annotation’ column will contain the descriptive text of your annotation.
Manually Adding Annotations to Your Spreadsheet
- In the ‘Date’ column, enter the date of your annotation. Ensure the date format matches your Google Sheets settings (e.g., MM/DD/YYYY for US settings). You can check or change this by going to File > Spreadsheet settings.
- In the ‘Category’ column, input the category of your annotation (if you’re using categories).
- In the ‘Annotation’ column, write a concise note that describes the event or change.
Automating Annotations with Google Calendar and Zapier
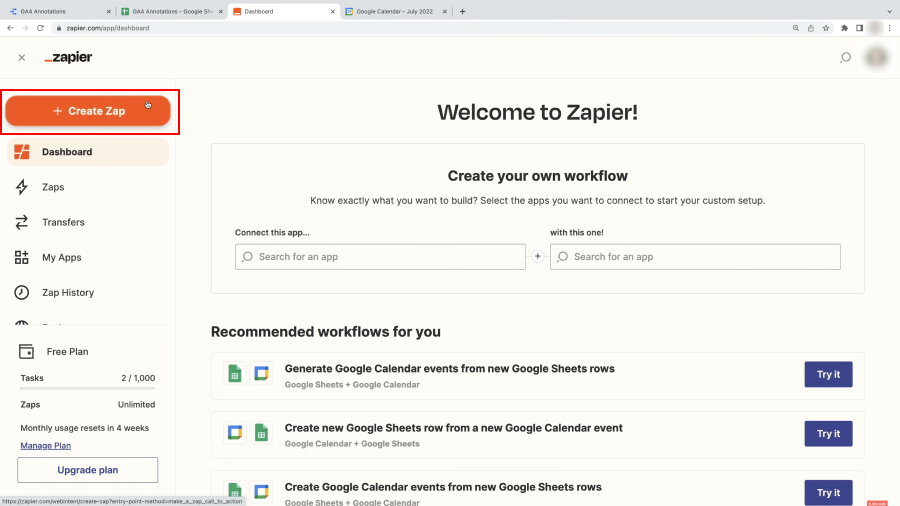
1. Setting Up Zapier:
- Go to Zapier and sign in or create an account.
- Click on “Create Zap” to start a new automation.
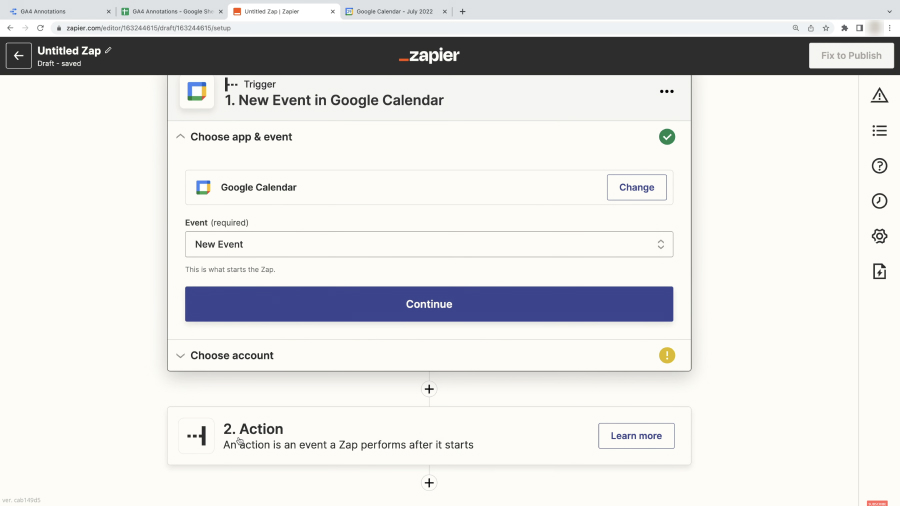
2. Configure the Trigger:
- Search for and select ‘Google Calendar’ as the trigger app.
- Choose ‘New Event’ as the trigger event and click ‘Continue’.
- Connect your Google Calendar account by signing in and authorizing Zapier to access it.
- Select the specific calendar you want to use for annotations, then click ‘Continue’.
3. Test the Trigger:
- Click ‘Test Trigger’ to ensure Zapier can find an event in your calendar.
- Once a test event is found, click ‘Continue’.
4. Configure the Action:
- Search for and select ‘Google Sheets’ as the action app.
- Choose ‘Create Spreadsheet Row’ as the action event and click ‘Continue’.
- Connect your Google Sheets account by signing in and authorizing Zapier.
- Select the ‘GA4 Annotations’ spreadsheet and the specific worksheet you’re using.
- Map the ‘Event Begins’ to the ‘Date’ column, ‘Location’ (or another suitable field) to ‘Category’, and ‘Summary’ to ‘Annotation’.
- Click ‘Continue’ and then ‘Test & Review’ to send a test entry to your spreadsheet.
5. Finalize and Activate Your Zap:
- Name your zap (e.g., ‘GA4 Annotations’) for easy identification.
- Turn on your zap to automate the process. Now, new events added to your selected Google Calendar will automatically be added as annotations in your Google Sheets spreadsheet.
Creating and Configuring Your Report in Google Data Studio
1. Start Your Report in Google Data Studio:
- Navigate to Google Data Studio and start a new report.
- Add your GA4 property as a data source and then add the Google Sheets spreadsheet you prepared as another data source.
2. Blending Data Sources:
- Go to ‘Resource’ > ‘Manage Blends’ and create a new blend.
- Add your GA4 data source and the Google Sheets annotations as tables to the blend.
- Use ‘Date’ as the join key between the two tables.
- Include relevant metrics from GA4 and the ‘Annotation’ and ‘Category’ fields from your spreadsheet.
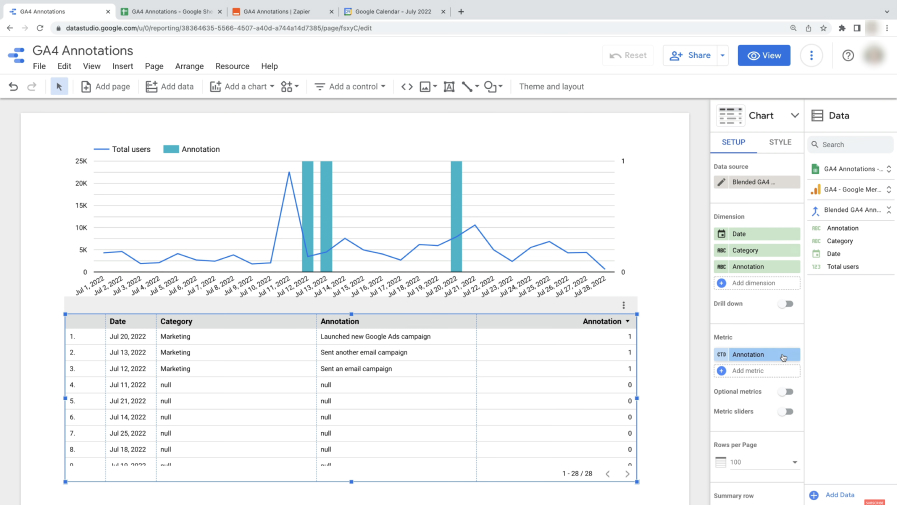
3. Visualizing Annotations:
- Remove any default tables or charts.
- Add a time series chart to visualize user metrics over time.
- Configure the chart to use the blended data source. Customize it to display annotations, adjusting styles as necessary to differentiate annotation dates visually.
4. Refining the Report:
- Add a table to display ‘Category’ and ‘Annotation’ details. Configure sorting and filtering to exclude rows where ‘Annotation’ is null.
- Utilize filters and custom configurations to ensure the report clearly displays the annotations alongside your GA4 data metrics.
5. Review and Adjust:
- After adding new events to your Google Calendar and seeing them reflected in your Google Sheets, refresh your Google Data Studio report to see the updates.
- Make any necessary adjustments to your Zap, Google Sheets, or Data Studio report configurations to ensure accuracy and clarity in your annotations.
The Future of Annotations in GA4
The analytics community has expressed a strong desire for the reintroduction of Annotations in GA4, and it’s possible that future updates to GA4 may include this feature or a similar one. Keeping abreast of GA4 updates and engaging with the Google Analytics support community can provide the latest methods for integrating annotations or their equivalents into your data analysis workflow.
Conclusion

Google Analytics Annotations, while seemingly simple, offer a robust mechanism for enriching your data analysis with contextual insights. In Universal Analytics, they serve as an integral part of the platform, allowing users to mark and remember the impact of internal and external events on website performance. As the analytics community transitions to Google Analytics 4, adapting to new workflows and awaiting feature updates is part of the journey. By creatively employing workarounds and staying informed on GA4 developments, analysts and marketers can continue to leverage the power of context in their data analytics practices.
As Google Analytics evolves, so too does the way we interact with and interpret data. Annotations, whether in their traditional form or through new methodologies in GA4, remain a testament to the importance of context in data analysis. By effectively utilizing these tools, professionals can ensure that their analytics efforts are as informed and insightful as possible, leading to better decision-making and strategic planning.
In the realm of digital analytics, where data flows abundantly, let us not forget the power of a simple note to illuminate the path of understanding. Annotations in Google Analytics, in any form, stand as beacons of context in the sea of numbers, guiding us to more meaningful insights and strategies.