


Cart 0


Google Analytics is a powerful tool that helps website owners and digital marketers track and analyze their site traffic. It compiles data into insightful reports, revealing who visits your site, how they arrived, and their activities during their visit.
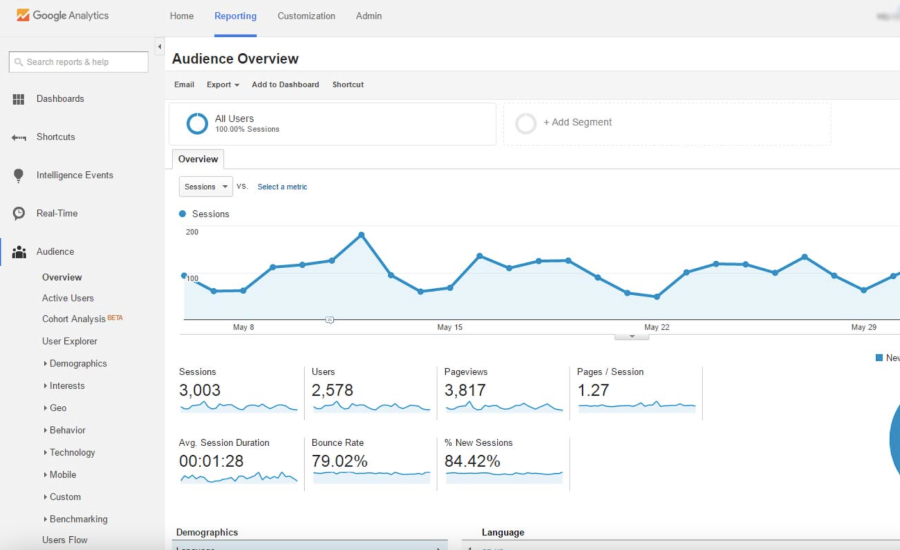
A crucial feature of Google Analytics is the Audience Reports section. These reports provide detailed insights into your visitors’ demographics, interests, and behaviors, allowing you to customize your content, design, and marketing strategies to better meet their needs and preferences, enhancing user engagement and boosting conversions.
What are Audience Reports?
This section helps you understand the composition of your audience, their preferences, and their engagement patterns.
 Key Metrics Explained:
 Key Metrics Explained:
- Users: This metric counts the total number of visitors to your site during a specified time frame, including both new and returning users.
- New Users: The number of first-time visitors to your site within the selected period.
- Sessions: A session is a group of user interactions with your website that take place within a given timeframe. A single session can contain multiple page views, events, social interactions, and ecommerce transactions.
- Number of Sessions per User: This ratio indicates the average number of sessions each user initiates, offering insights into user engagement.
- Pageviews: The total number of pages viewed. Repeated views of a single page are also counted.
- Pages per Session: An average showing how many pages are viewed during a single session, which helps gauge how engaging and interconnected your content is.
- Average Session Duration: The average length of a session on your site, providing a measure of how long users stay engaged with your content.
- Bounce Rate: The percentage of single-page sessions in which the person left your site from the entrance page without interacting with it. A high bounce rate might indicate that the site entrance pages aren’t relevant to your visitors.
Navigating the Audience Reports in Google Analytics
Step-by-step Instructions on How to Access Audience Reports:
 Step-by-step Instructions on How to Access Audience Reports:
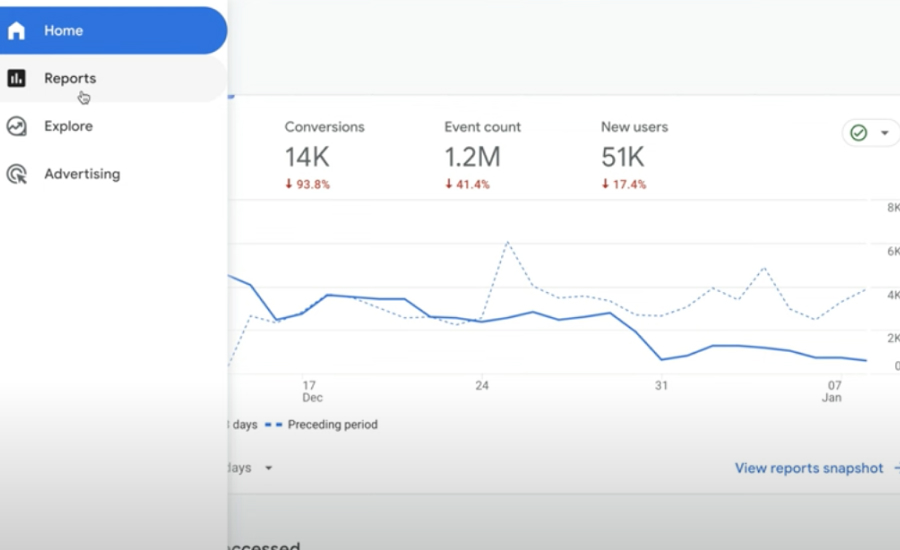
- Log in to Google Analytics: Start by signing into your Google Analytics account.
- Select the Property: Choose the property that corresponds to the website you want to analyze.
- Access Reports: On the left sidebar, click on ‘Audience’ to expand the menu. This is where all Audience Reports are housed.
- Explore Reports: Under the ‘Audience’ section, you’ll find various sub-categories such as Overview, Demographics, Interests, Geo, Behavior, Technology, Mobile, Cross-Device, and Custom. Click on any of these to view detailed reports.
Navigating Different Parts of the Report:
- As you select a specific report, you’ll see the data displayed in various formats like tables, pie charts, or line graphs.
- You can change the date range in the upper right corner to analyze data from different time periods.
- Use the ‘Add Segment’ button at the top of the report to compare different user segments side-by-side.
Tips on Customizing Views and Data Comparisons:
- Customizing Dashboards: You can create custom dashboards by clicking on ‘Customization’ in the navigation menu, allowing you to have a personalized view of the metrics that matter most to you.
- Adjust Metrics: Customize the metrics displayed in report tables by clicking on the ‘Customize’ link above the table. This lets you add, remove, or rearrange the metrics.
- Comparative Analysis: Utilize the ‘Compare to’ feature to compare data across different time periods or to the average site data, providing a clearer context for your analytics.
Detailed Analysis of Each Section
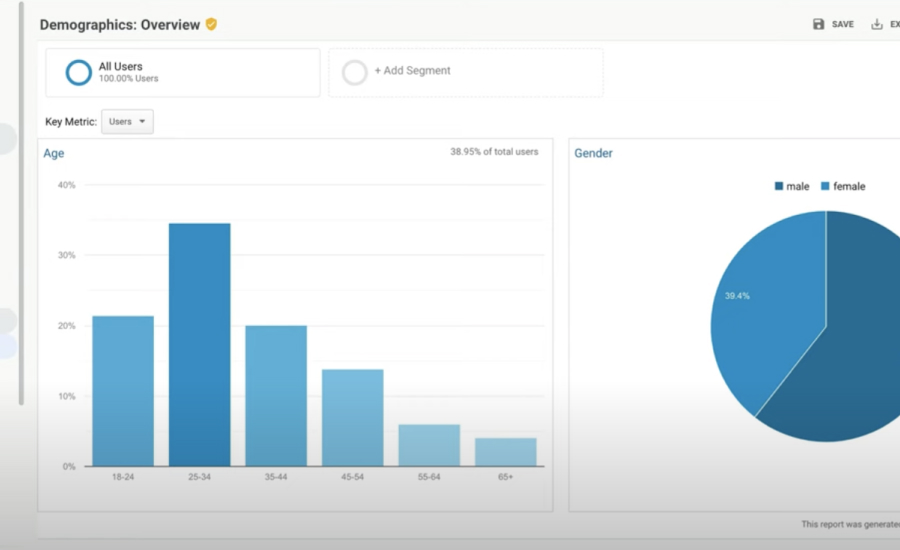
Demographics: Interpreting Age and Gender Data
 Demographics: Interpreting Age and Gender Data
- Understanding the Data: The Demographics section breaks down your audience by age and gender, providing insight into who your visitors are. This information can help tailor your marketing strategies and content to better suit your primary audience.
- Practical Application: For instance, if you find a majority of your audience is in the 25-34 age range, you might focus more on creating content that appeals to young professionals.
Interests: Understanding User Interests
- Understanding the Data: This section categorizes users based on their interests such as technology, fashion, or sports, which helps in creating more targeted advertising and content strategies.
- Practical Application: If a significant portion of your audience is interested in technology, consider incorporating more tech-related topics or products in your content or advertisements.
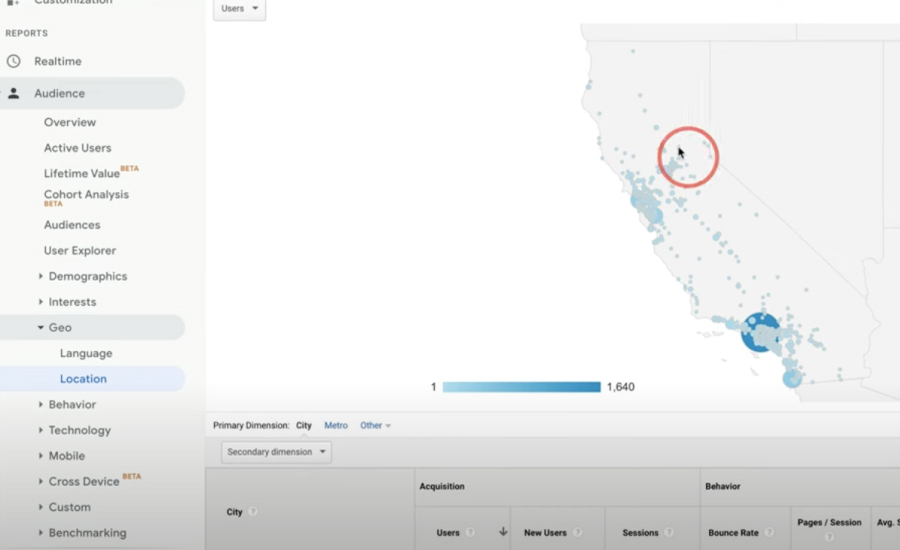
Geo: Analyzing Language and Location Data
- Understanding the Data: Geo reports provide language and geographical data, showing where your visitors come from and what languages they speak. This aids in localizing your website content, SEO, and marketing campaigns.
- Practical Application: If you have a high number of visitors from non-English speaking countries, it might be beneficial to offer translated versions of your site or posts.
Behavior: New vs. Returning Visitors, Engagement Metrics
- Understanding the Data: Behavior insights focus on how new versus returning visitors interact with your site, including their engagement levels measured by metrics like bounce rate and session duration.
- Practical Application: Tailoring user experience based on loyalty; for example, creating loyalty rewards for returning visitors or simplified navigation for new users to increase engagement.
Technology: Browser and Network Insights, Mobile vs. Desktop Usage
 Technology: Browser and Network Insights, Mobile vs. Desktop Usage
- Understanding the Data: This section reveals what devices and browsers your audience uses, which can significantly impact how you design and test your website.
- Practical Application: Ensuring your site is optimized for the most used devices and browsers among your audience can improve user experience and decrease bounce rates.
Mobile: Breakdown of Mobile Traffic, Performance Analysis
- Understanding the Data: The Mobile section examines how much of your traffic comes from mobile devices and evaluates the performance of your site on these devices.
- Practical Application: If mobile traffic is high but engagement is low, it may indicate the need for better mobile site optimization.
Conclusion
Google Analytics’ Audience Reports are invaluable for any website owner or marketer aiming to understand and enhance user interaction. These reports offer a detailed view of who your visitors are, how they behave, and what interests them, providing a solid foundation for making informed decisions about your content and marketing strategies.
Keep exploring, keep testing, and keep optimizing to stay ahead in the competitive online world.