

Cart 0


In today’s digital age, having a strong online presence is crucial for businesses and individuals alike. One powerful tool at your disposal is Google Search Console (GSC), a free service offered by Google that helps you monitor, maintain, and optimize your site’s visibility in Google Search results. Among its various features, the Performance Report is particularly valuable for understanding how your website performs in search results. This article provides an in-depth look at setting up and interpreting GSC Performance Reports to enhance your website’s SEO and overall performance.
Setting Up Google Search Console
Before diving into Performance Reports, you need to set up your Google Search Console account. If you haven’t already, follow these steps:
- Create or Sign In to Your Google Account: Use an existing Google account or create a new one.
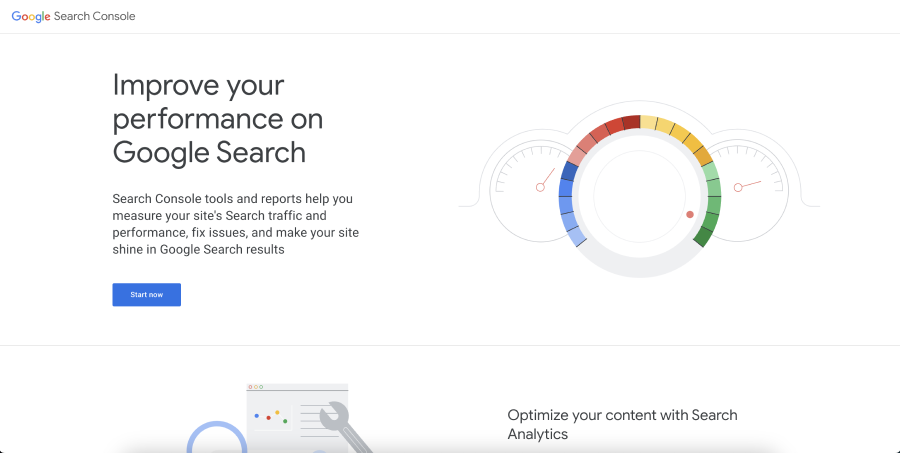
- Add Your Website to GSC: Visit the Google Search Console website and add your site by clicking on ‘Add Property.’ Choose between domain-level or URL-prefix methods to verify your site ownership.
- Verify Your Website: Verify your site ownership through various methods like HTML file upload, domain name provider, HTML tag, Google Analytics, or Google Tag Manager.
- Submit Your Sitemap: If you have a sitemap, submit it to GSC to help Google better understand your site structure.
Understanding the Performance Report
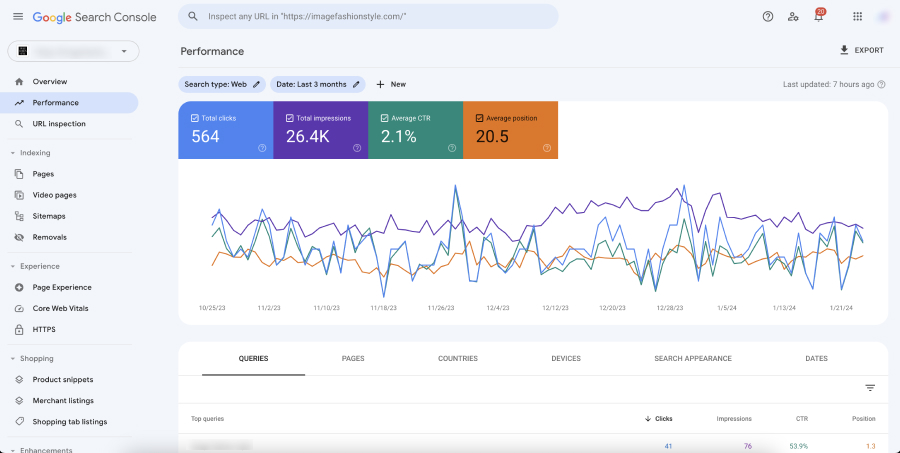
The Performance Report in Google Search Console is a critical tool for any webmaster, digital marketer, or SEO professional. It provides detailed insights into how your website is performing in Google’s search results. Here’s a deeper look at each metric and what it tells you about your site’s performance:
Clicks
- Definition: This metric represents the total number of times users have clicked through to your website from Google search results.
- Importance: Clicks are a direct indicator of traffic from organic search. More clicks generally mean higher user interest and effective search visibility.
- Usage Tips: Analyze which queries and pages are getting the most clicks to understand what attracts your audience. Use this information to replicate successful strategies across other pages or content.
Impressions
- Definition: Impressions refer to the number of times any URL from your site appeared in search results viewed by a user, not considering whether it was scrolled into view or clicked on.
- Importance: Impressions give you an idea of the visibility and reach of your website in search results. High impressions with low clicks can indicate that your site is visible but not enticing enough to click.
- Usage Tips: Use impressions to gauge the effectiveness of your SEO efforts in increasing visibility. Look for trends in impressions to understand how changes in SEO or content impact your site’s reach.
Click-Through Rate (CTR)
- Definition: CTR is calculated as the percentage of impressions that resulted in a click. It’s a key measure of how effective your site is at enticing users to click through from the search results.
- Importance: CTR helps you understand how appealing your site is in the context of search results. A low CTR might suggest that your titles or meta descriptions are not compelling enough.
- Usage Tips: Experiment with different titles and meta descriptions to improve CTR. Look for patterns in high-CTR queries and pages, and apply these learnings to other areas of your site.
Average Position
- Definition: This metric indicates the average ranking of your site in search results for particular queries.
- Importance: It helps you understand the competitiveness of your keywords and the effectiveness of your SEO strategies in ranking your pages.
- Usage Tips: Monitor average position to identify ranking improvements or declines. Use this data to refine your keyword strategy and prioritize SEO efforts on pages that have the potential to climb into higher positions.
Additional Insights
Apart from these primary metrics, the Performance Report also offers insights into:
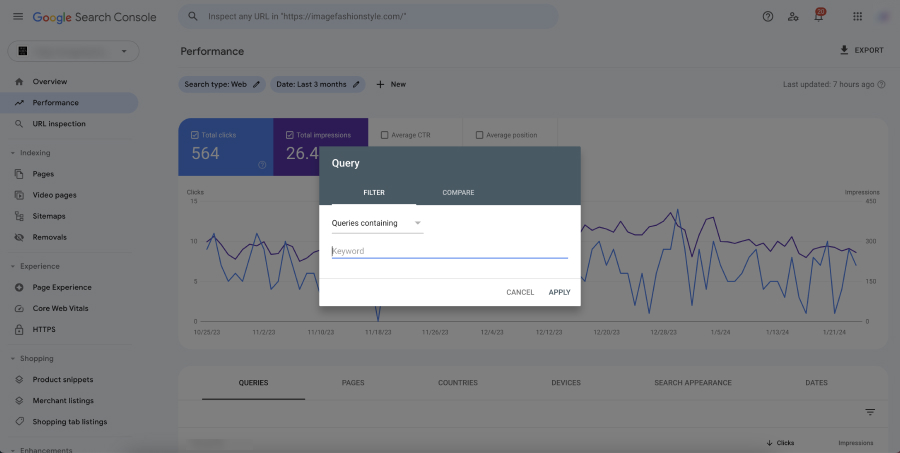
- Queries: The actual search terms that led users to your site. Analyzing query data can reveal new keyword opportunities and insights into user intent.

- Pages: Which specific pages on your site are performing well in search results, helping you understand what content resonates with your audience.
- Countries: See how your site performs in different geographical locations, which is crucial for localized SEO strategies.
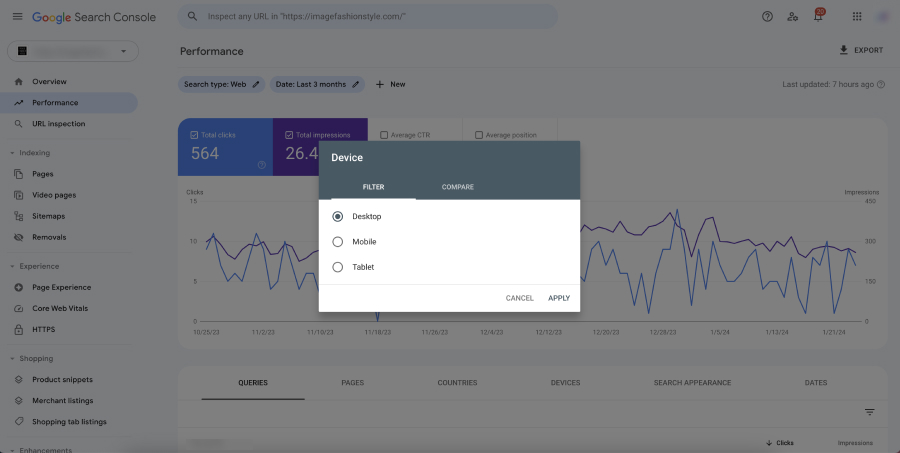
- Devices: Understand how your site performs across different devices (desktop, mobile, tablet), highlighting the importance of mobile optimization.
Interpreting Data from Google Search Console Performance Reports
Effectively interpreting the data from Google Search Console’s Performance Reports is key to enhancing your website’s SEO strategy and overall performance. Here’s a guide on how to analyze and draw meaningful insights from the data:
Analyzing Trends Over Time
- Long-Term Analysis: Look at your data over extended periods (months, quarters) to identify long-term trends. This helps in understanding the overall health and growth of your site in search results.
- Short-Term Fluctuations: Be aware of short-term fluctuations in your data. These can be due to seasonal changes, algorithm updates, or other market factors. Avoid making hasty decisions based on these temporary changes.
Comparing Data Segments
- Query Comparison: Compare performance data for different queries to identify which keywords are most effective in driving traffic and which need improvement.
- Page Performance: Evaluate individual pages to see which are performing well and which are underperforming. This can guide content optimization and reveal opportunities for internal linking or content updates.
- Device and Location Analysis: Analyze performance across different devices and locations. This can inform you about the need for mobile optimization or localized content strategies.
Understanding User Intent
- Interpreting Queries: Look at the search queries bringing users to your site. Are they informational, transactional, or navigational? This understanding can help tailor content to match user intent, potentially increasing CTR and conversions.
- Alignment with Business Goals: Ensure that the queries and pages driving traffic align with your business goals and target audience. High traffic for irrelevant queries might not contribute to your overall objectives.
Identifying Opportunities and Issues
- Spotting Opportunities: Look for high-impression but low-CTR queries. These might be opportunities to improve titles, meta descriptions, or page content to capture more clicks.
- Technical Issues: A sudden drop in clicks or impressions might indicate technical issues like crawling errors or penalties. Use GSC’s other reports, like the Coverage Report, to diagnose and fix these problems.
Integrating with Other Data
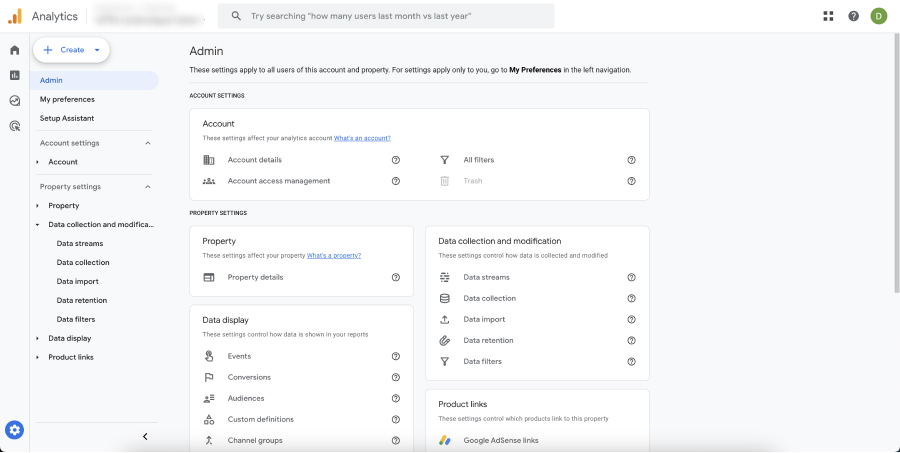
- Combining with Google Analytics: For a more comprehensive view, combine GSC data with Google Analytics. This provides insights into user behavior after they click through to your site.
- Competitive Analysis: Use the data to benchmark your site against industry standards or competitors (where data is available), to understand your relative performance.
Actionable Insights
- Prioritizing SEO Efforts: Based on your analysis, prioritize SEO efforts on high-impact areas. This might include optimizing high-traffic pages, improving rankings for specific keywords, or enhancing mobile user experience.
- Content Strategy Development: Use query data to inform your content strategy. Create or update content to address popular queries, fill content gaps, or target new keywords.
Regular Review and Adaptation
- Continuous Monitoring: Regularly review your Performance Report to stay updated on your site’s performance and quickly adapt to changes in search trends or algorithm updates.
- Testing and Learning: Use the insights gained to test new SEO strategies and content ideas. Continuously learn from the data and refine your approach for optimal results.
Utilizing the Data for SEO Optimization
The data from the Performance Report is invaluable for SEO optimization. Here’s how you can use it:
- Identify Top-Performing Keywords: Discover which keywords are driving traffic to your site and optimize your content around them.
- Improve Underperforming Pages: Analyze pages with low CTR or average position and improve their content, meta tags, and user experience.
- Optimize for Devices: Understand how your site performs on different devices and make necessary adjustments for mobile optimization.
- Understand Geographical Performance: Tailor your content and SEO strategies to target audiences in specific regions or countries.
Common Pitfalls and Best Practices
While using the Performance Report, avoid common pitfalls and follow best practices:
- Don’t Obsess Over Short-term Fluctuations: Search rankings can fluctuate due to various factors. Focus on long-term trends.
- Combine GSC Data with Other Tools: Use data from Google Analytics and other SEO tools for a more comprehensive analysis.
- Regularly Monitor and Update: Continuously monitor your Performance Report and update your SEO strategies accordingly.
Conclusion
Google Search Console’s Performance Reports are a goldmine of insights for anyone looking to enhance their website’s search visibility and SEO. By properly setting up GSC, understanding the metrics, and effectively utilizing the data, you can make informed decisions to optimize your website’s performance in Google Search. Remember to stay updated with Google’s guidelines and continuously refine your strategies for the best results.