


Cart 0


In the era of data-driven decision-making, understanding the ins and outs of your website’s analytics is crucial for success. Google Analytics (GA) has long been the go-to platform for webmasters, marketers, and analysts to track and analyze website traffic. With the introduction of Google Analytics 4 (GA4), the landscape of data analytics has evolved, offering new ways to understand user behavior. One of the most powerful features of both versions of Google Analytics is the ability to create custom reports. This comprehensive guide will walk you through finding, managing, and setting up custom reports in both Google Analytics and Google Analytics 4.
Finding Custom Reports in Google Analytics
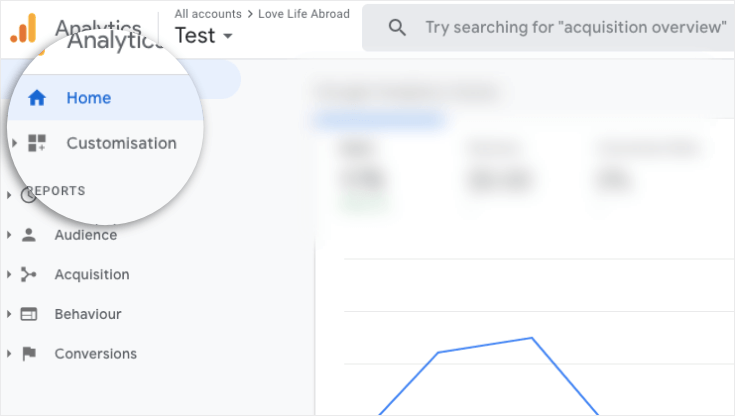
In the traditional version of Google Analytics, custom reports can be found by navigating to the “Customization” menu located in the header. From there, you have the option to create new reports or manage existing ones. The interface is intuitive, allowing users to dive into creating reports that cater specifically to their needs.
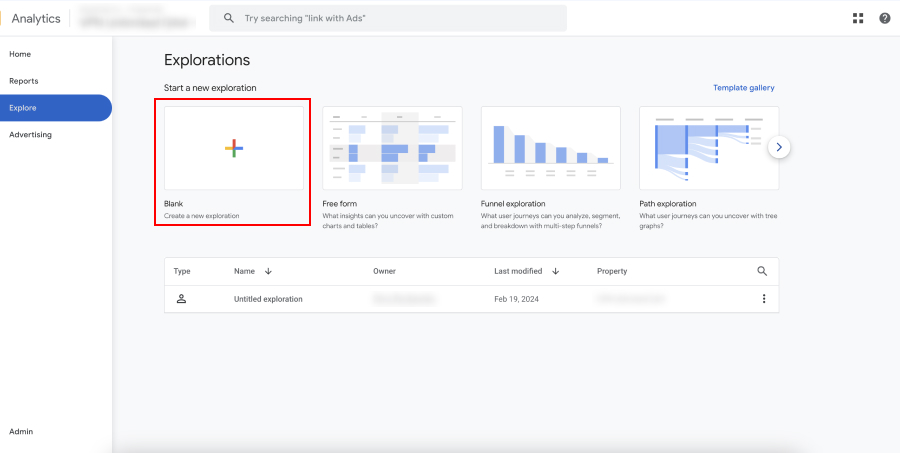
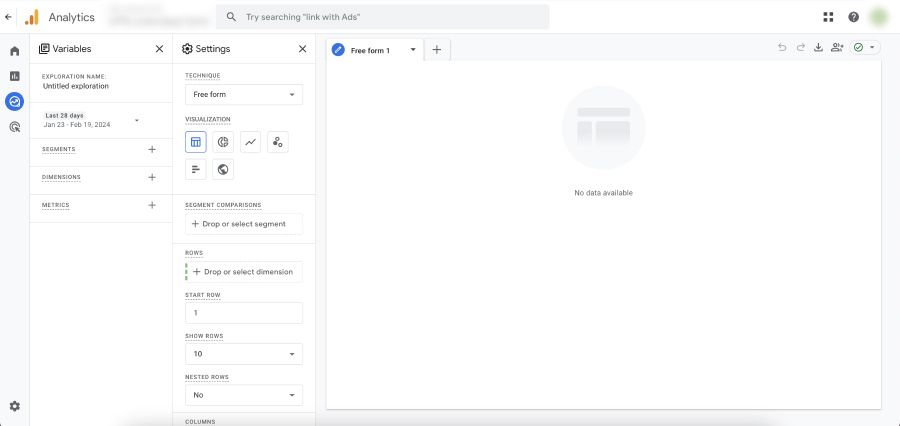
For GA4, the process differs slightly due to its new interface and data model. GA4 emphasizes events and user properties over sessions and pageviews, which changes how you’ll approach report creation. To find custom reports in GA4, you should look for the “Explore” section, which is GA4’s answer to the custom reporting needs of its users. This section allows for more flexibility and a deeper dive into the data collected by GA4.
Managing Custom Reports
Google Analytics
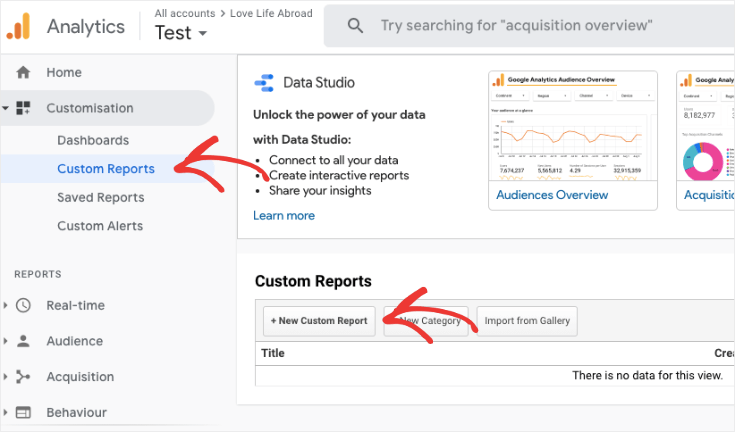
Once you’ve created custom reports in Google Analytics, managing them is straightforward. You can access all your reports under the “Customization” menu. Here, you can edit the metrics and dimensions, change the report’s name, and delete reports you no longer need. It’s also possible to share reports with others by exporting them in various formats or by setting up shared views within your GA account.
Google Analytics 4
In GA4, the “Explore” area is where your custom reports (now referred to as explorations) live. GA4 offers a suite of templates to get started, which can be customized further as needed. Managing these reports involves editing the parameters, adding or removing metrics, and adjusting the user segments being analyzed. GA4 also provides more collaborative features, allowing you to share explorations directly with team members or through scheduled email reports.
Setting Up Custom Reports
Google Analytics
Setting up custom reports in Google Analytics is a process that can be broken down into a few key steps:
- Define Your Objectives: Before diving into report creation, have a clear understanding of what you want to learn from your data. This will guide which metrics and dimensions you’ll need to include.
- Create a New Custom Report: Navigate to the “Customization” menu and select “New Custom Report.” Here, you’ll be prompted to choose the type of report (Explorer, Flat Table, Map Overlay, or Funnel).

- Select Metrics and Dimensions: Based on your objectives, choose the metrics (quantitative data) and dimensions (qualitative data) that will make up your report. Google Analytics offers a wide range of options to tailor your report precisely to your needs.
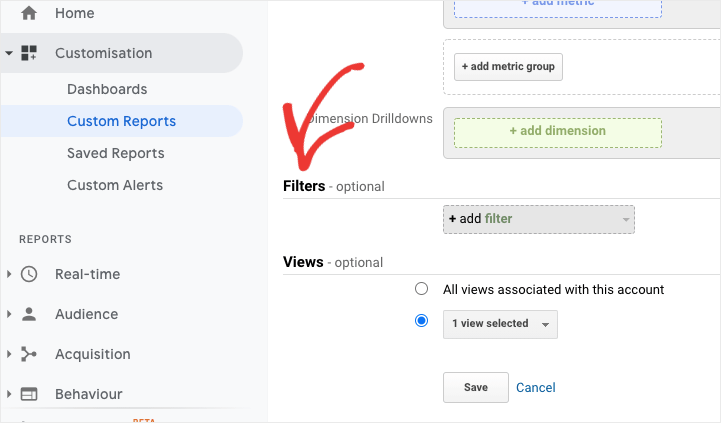
- Apply Filters: To narrow down the data, you can apply filters. This is especially useful if you’re only interested in specific segments of your traffic (e.g., traffic from a particular country or campaign).

- Save and View: Once you’ve configured your report, save it to view the results. You can always come back and edit the report if needed.
Google Analytics 4
Setting up custom reports in GA4 through the “Explore” feature involves a different approach due to its event-based model:
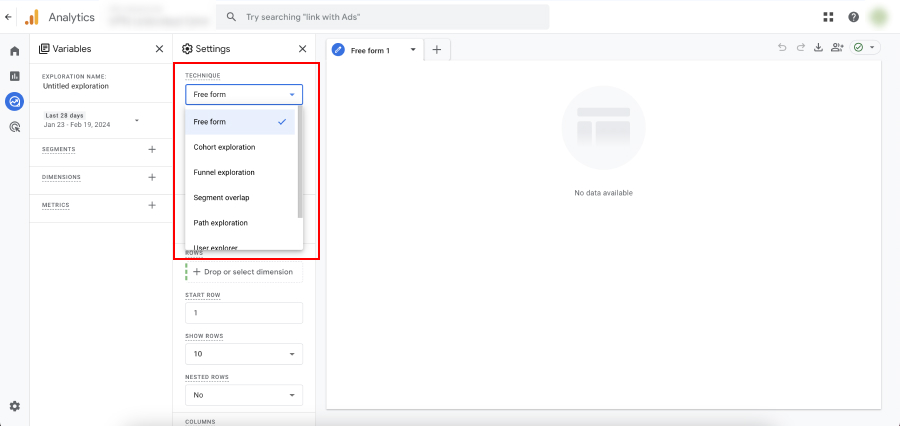
- Start with a Template or Blank Report: GA4 offers several exploration templates that can serve as a starting point. Alternatively, you can start with a blank report to build from scratch.

- Choose Your Variables: In GA4, variables include dimensions, metrics, and segments. Select these based on what insight you’re looking to gain from your report.

- Customize Your Analysis: Utilize the different types of analysis available in GA4, such as funnel analysis, path analysis, and segment overlap, to delve deeper into your data.
- Apply Comparisons: GA4 allows you to apply comparisons directly in your reports, enabling you to easily compare performance across different user segments.
- Share and Collaborate: Once your report is ready, you can share it with your team or schedule it to be sent out regularly.
Integrating Google Analytics with Other Tools
The integration of Google Analytics with other tools can significantly enhance your ability to draw comprehensive insights from your data. For example, linking GA with Google Ads allows you to track the effectiveness of your advertising campaigns directly within the GA interface. This integration provides a seamless way to measure how users acquired through Google Ads interact with your site, contributing to conversions and sales. Similarly, integrating Google Search Console with GA enriches your reports with valuable data on search query performance, enabling you to understand how users find your website through Google search.
Sharing and Collaborating on Reports
Google Analytics also facilitates collaboration through the sharing of reports. Custom reports can be shared with team members or stakeholders, ensuring everyone is aligned with the latest data insights.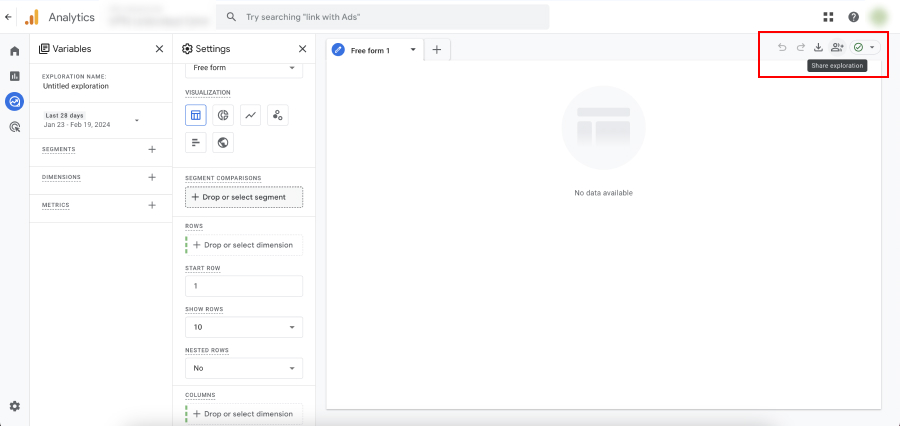
This feature is particularly useful for agencies or teams where multiple people are involved in decision-making processes based on website performance. Sharing insights can foster a data-driven culture within your organization, promoting informed decision-making across departments.
Conclusion
Customizing Google Analytics reports is an ongoing journey of discovery and optimization. By leveraging the full range of customization features, integrating with other tools, and embracing a culture of continuous improvement, you can transform your Google Analytics data into a strategic asset. Whether you’re a seasoned marketer, a data analyst, or a business owner, the ability to customize your analytics reports is an invaluable skill that can drive your online strategy forward.
Remember, the ultimate goal of customizing your Google Analytics reports is not just to collect data, but to extract meaningful insights that inform your business decisions. It’s about understanding the story behind the numbers, predicting future trends, and optimizing your online presence for success. As you become more comfortable with these customization techniques, you’ll find yourself making more informed decisions, backed by data-driven insights.
Now, armed with the knowledge of how to effectively customize Google Analytics reports, you’re ready to unlock the full potential of your data. Dive into your analytics with a curious mind and a strategic approach. The insights you discover will be the guiding light for your website’s journey to success.